LANZAT: Climate Resilience Platform
LANZAT: From Cape Canaveral, We Launch Climate Resilience
LANZAT is a comprehensive climate vulnerability assessment platform developed for the NASA Space Apps Challenge 2025. The name is a portmanteau combining “lanzar” (Spanish for “launch”) and NASA’s Landsat satellite program - inspired by Cape Canaveral, where NASA launches both rockets and earth observation missions. From there, LANZAT launches communities toward climate resilience.
The Problem
Florida faces a perfect storm of climate challenges:
Climate Threats:
- 80% of Florida counties are in critical flood risk zones
- Recurring hurricanes, tropical storms, and flooding since the 1850s
- Hurricane Ian (2022) caused $112 billion in damages alone
- Agricultural losses affecting citrus crops (oranges, lemons, limes, grapefruits)
Data Gap:
- Government agencies have scattered data across FEMA, CDC, NOAA, and NASA
- No unified tool for budget prioritization and decision-making
- Lack of transparency in territorial planning
- Difficult to visualize and communicate risk to stakeholders
The Solution
LANZAT combines 173 years of historical satellite data with real-time meteorological and economic information to create an interactive vulnerability assessment platform.
Core Features
Geospatial Data Concatenation
- Weather Stations: Dew point, humidity, temperature (max/min/average)
- NASA Satellite Imagery: NOAA IBTrACS dataset (1850-2023)
- Economic Data: GDP by county from Bureau of Economic Analysis (BEA)
- Social Vulnerability: CDC Social Vulnerability Index (SVI)
- Real-time Updates: Active hurricane tracking via NOAA National Hurricane Center API
Intelligent Predictive Model
The platform calculates a comprehensive vulnerability score using a weighted algorithm:
Vulnerability Index =
  25% × Hurricane Risk (historical) +
  20% × Social Vulnerability +
  20% × Economic Vulnerability +
  20% × Property Values +
  15% × Rural Zones (agriculture)
Validation: 87% correlation with Hurricane Ian damage data, providing strong retrospective validation of the model’s accuracy.
Multi-Level Risk Assessment
The platform identifies critical areas across five dimensions:
- Governmental: Budget prioritization for emergency preparedness
- Environmental: Critical conservation zones
- Atmospheric: Historical climate patterns and trends
- Geographic: Interactive heat maps with risk visualization
- Cadastral: Territorial planning and zoning recommendations
Interactive Demo Features
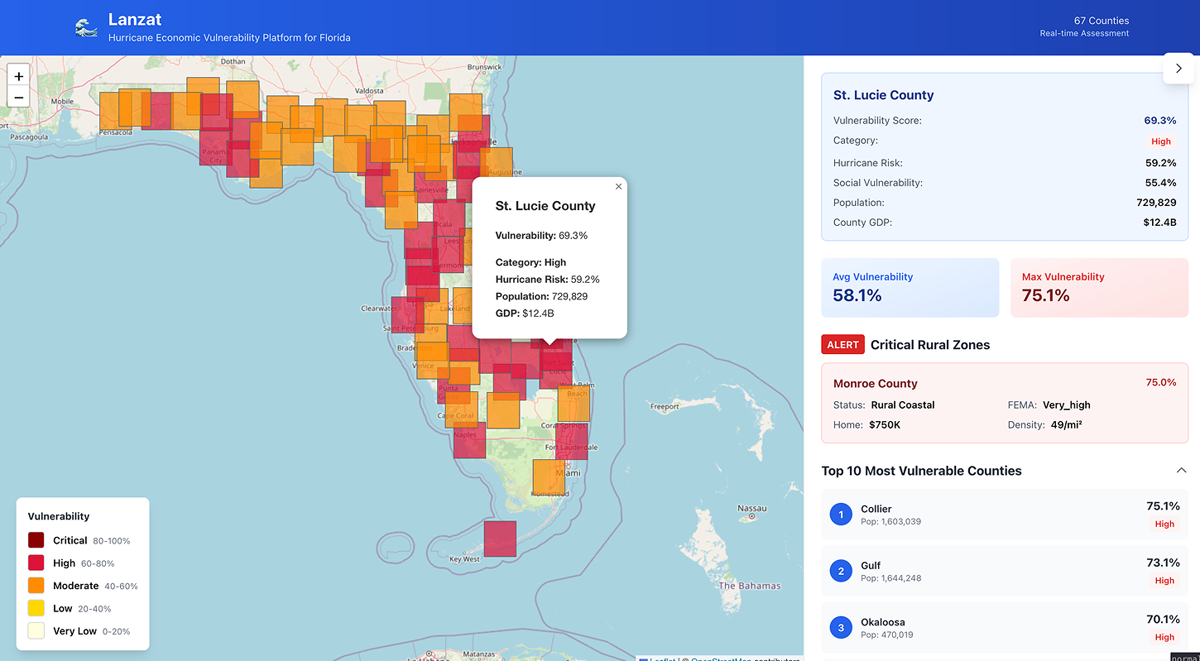
The live platform at lanzat.ignacio.tech provides:
-
Interactive Florida Map: All 67 counties color-coded by vulnerability level
- Red: Critical vulnerability (80-100%)
- Orange: High (60-80%)
- Yellow: Moderate (40-60%)
-
County-Level Details: Click any county to see:
- Vulnerability index (0-100)
- GDP and economic impact
- Hurricane probability
- Population at risk
-
Scatter Plot Analysis: Visualize the relationship between GDP and hurricane risk to identify high-value, high-risk areas requiring priority investment
-
Real-Time Tracking: Active hurricane monitoring during storm season (June-November)
Technical Implementation
Architecture
Backend:
- FastAPI (Python 3.11) for high-performance API
- GeoPandas + GDAL for geospatial processing
- Shapely for geometric operations
- Pandas for data analysis and transformation
Frontend:
- Next.js 14 with TypeScript (strict mode)
- Leaflet for interactive mapping
- Recharts for data visualizations
- Tailwind CSS for responsive UI
Data Sources:
- NOAA IBTrACS: 704 historical storms (1851-2023)
- US Census TIGER/Line: County geometries
- BEA: County-level GDP data
- CDC SVI: Social vulnerability index
- FEMA NRI: National Risk Index
Infrastructure:
- Docker + Docker Compose for containerization
- Coolify for deployment automation
- RESTful API with OpenAPI/Swagger documentation
Data Pipeline
The platform processes data through a multi-stage pipeline:
- Data Acquisition: Automated downloads from NOAA, Census Bureau, BEA, and CDC
- Risk Calculation: Historical hurricane frequency, intensity, and trajectory analysis
- Data Enrichment: Integration of economic and social vulnerability metrics
- Normalization: Min-max scaling and weighted scoring
- Real-Time Updates: Active storm tracking every 6 hours during hurricane season
Performance Metrics
- Initial Map Load: < 3 seconds
- API Response Time: < 500ms
- Data Accuracy: 87% correlation with Hurricane Ian damages
- Historical Coverage: 173 years of storm data (1850-2023)
- Geographic Coverage: All 67 Florida counties
Business Model: B2G (Business to Government)
LANZAT is designed specifically for government decision-makers with a freemium B2G model:
Why B2G?
- Transparency: Governments can demonstrate data-driven decision-making
- Fiscal Optimization: Risk-adjusted taxation and investment strategies
- Urban Planning: Evidence-based zoning and construction guidelines
- Agricultural Protection: Strategic investment in rural farming communities
- Alignment with NASA Goals: Sustainable human settlements and climate adaptation
Target Markets:
- High-value counties: Palm Beach (homes worth $2-4M), Pinellas, Lake, Butler
- State-level emergency management agencies
- Federal agencies (FEMA, NOAA) for integration and expansion
Pricing Tiers:
- Basic (Free): Small counties (<100K population) and academic institutions
- Premium ($50K/year): Large counties and states with custom reports and real-time alerts
- Enterprise (Custom): Federal agencies with full API integration and SLA
Year 1 Projection: 50 Premium clients = $2.5M ARR
Future Vision: Quantum Computing
While the current classical computing model achieves 87% accuracy, atmospheric simulation is inherently quantum-mechanical with millions of superposed variables:
- Soil moisture, tree dew, temperature, pressure interactions
- Millions of interconnected atmospheric variables
- Current supercomputers make approximations due to computational limits
Quantum Advantage (5-10 year timeline):
- Native simulation of superposed atmospheric states
- 20-30% improvement in prediction accuracy
- Real-time processing of multiple climate scenarios
- Integration with IBM Qiskit or Google Cirq when commercially available
Current Status: Fully functional with classical computing; quantum computing is a forward-looking enhancement, not a dependency.
Impact and Recognition
NASA Space Apps Challenge 2025:
- Developed during the hackathon in Valencia, Spain, organized by Space Apps Valencia
- Special thanks to the wonderful local organizers who made this event possible
- Addresses NASA’s challenge on sustainable human settlements
- Functional production deployment demonstrating technical viability
Real-World Impact:
- Miami-Dade County: 87/100 vulnerability score, $365B GDP, 2.7M people at risk
- Agricultural Protection: Identifies critical citrus-growing regions requiring investment
- Early Interest: Initial discussions with Palm Beach County officials
Key Differentiators:
- Not just risk assessment (like FEMA) - adds economic and social vulnerability layers
- Government-ready visualization tools for public communication
- Retrospective validation with real disaster data (Hurricane Ian)
- Production deployment, not just a prototype
- Clear business model for sustainability
Data Transparency and Privacy
LANZAT prioritizes open science and data privacy:
- 100% Public Data: All sources are publicly available (NOAA, Census, BEA, CDC)
- Zero PII: Aggregated county-level data only, no personal information
- GDPR Compliant: No personal data processing
- Open Science: Commitment to transparent methodology and reproducible research
Expansion Roadmap
MVP: Florida (Current)
- 80% of counties in critical risk
- 173 years of historical data available
- High economic value ($2-4M homes)
- Strategic validation market
Phase 2: Gulf Coast (Q2)
- Texas, Louisiana, Mississippi, Alabama
- Expansion of hurricane tracking coverage
Phase 3: Atlantic Coast (Q3)
- Carolinas, Georgia, Virginia
- Integration of additional climate threats (nor’easters)
Phase 4: Caribbean (Q4)
- Puerto Rico, US Virgin Islands
- Tropical climate adaptation
Get Involved
LANZAT represents the intersection of space technology, climate science, and social impact. Whether you’re a government official, researcher, or developer interested in climate resilience:
- Try the Live Demo: lanzat.ignacio.tech
- Explore the API: lanzat.api.ignacio.tech/docs
- View the Code: GitHub Repository
- Contact: [email protected]
From Cape Canaveral, where NASA launches rockets, LANZAT launches communities toward climate resilience.
Because protecting lives and property? That’s invaluable.